
|
|
")
|

Results
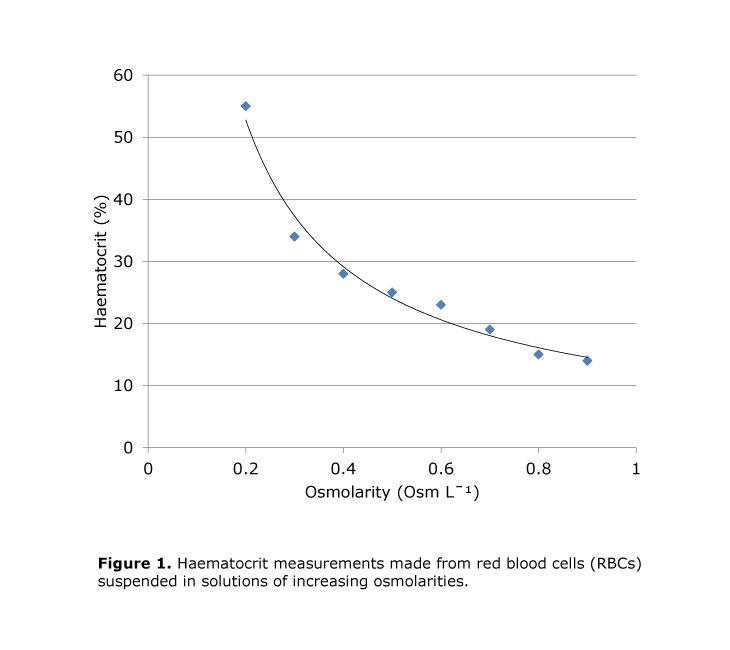
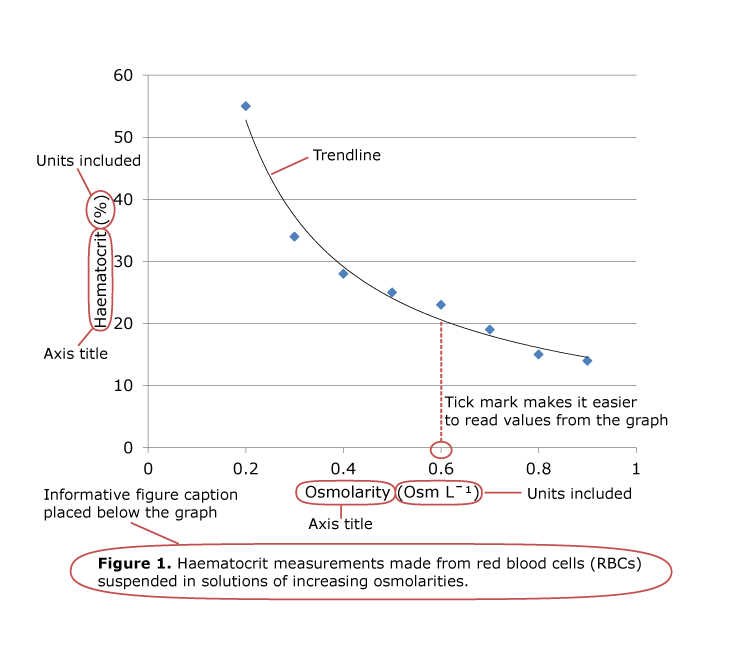
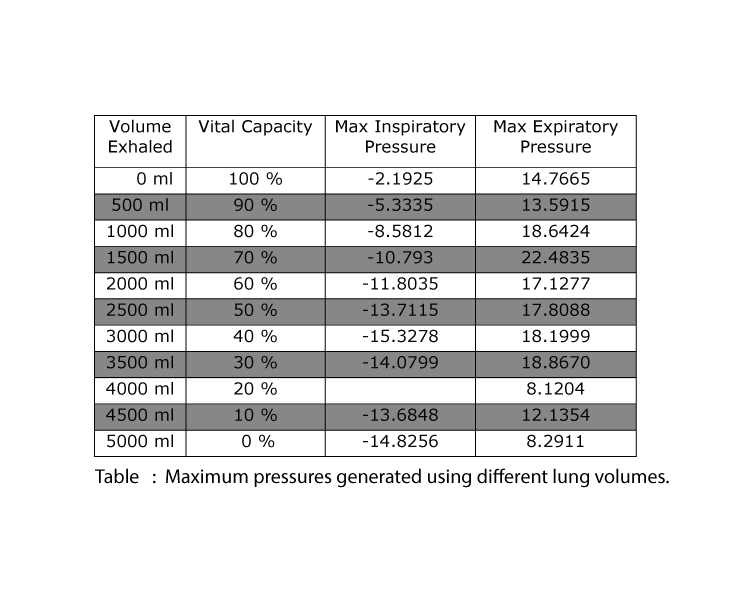
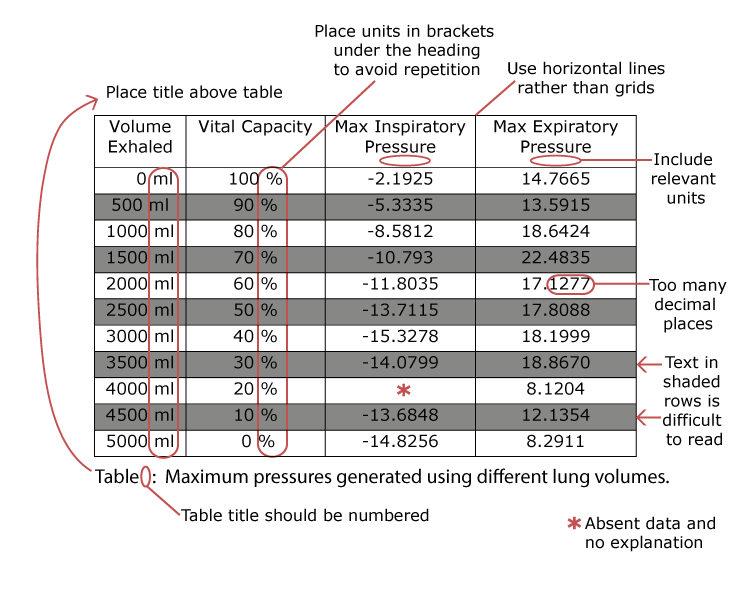
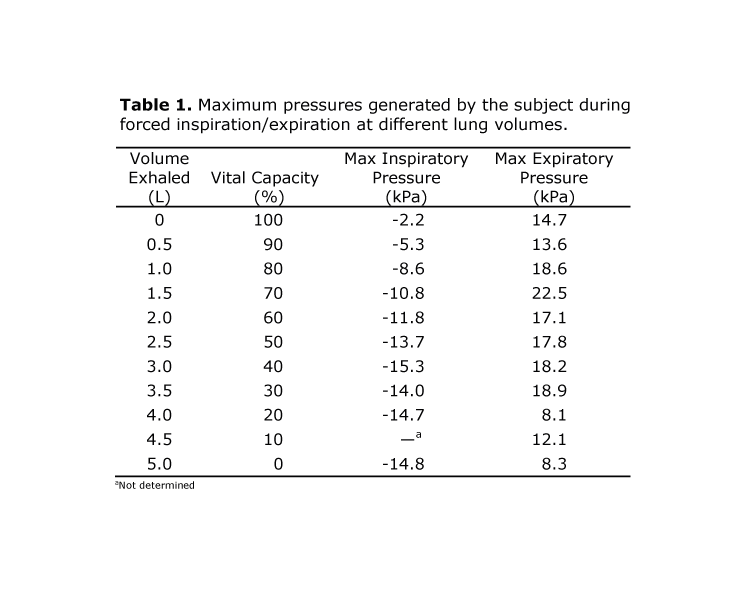
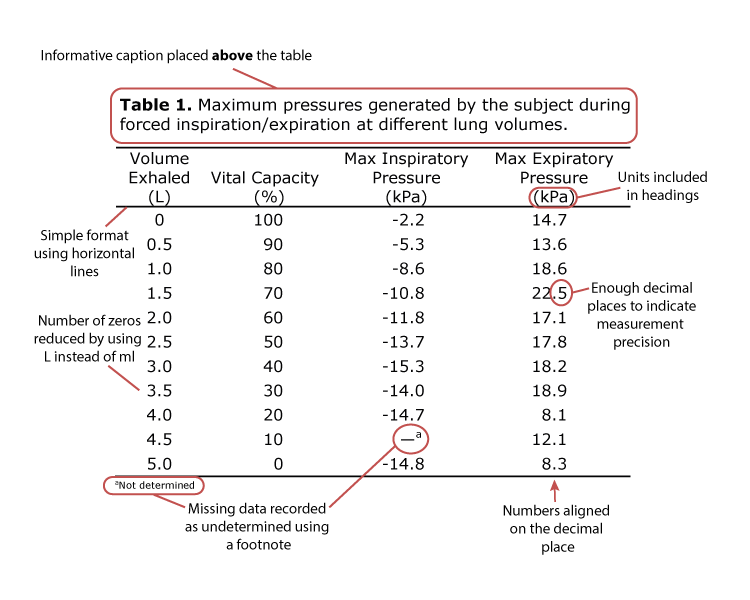
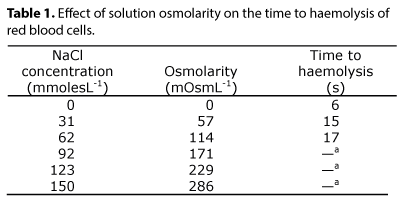
The results section is where you present the data you produced from your experiments. Your raw data will normally be summarised in tables and figures. The tables and figures are supported by text that highlights the important trends shown in the data. Each table and figure should have corresponding text.
Examples
Click on the bars below to see examples of figures, tables and text.
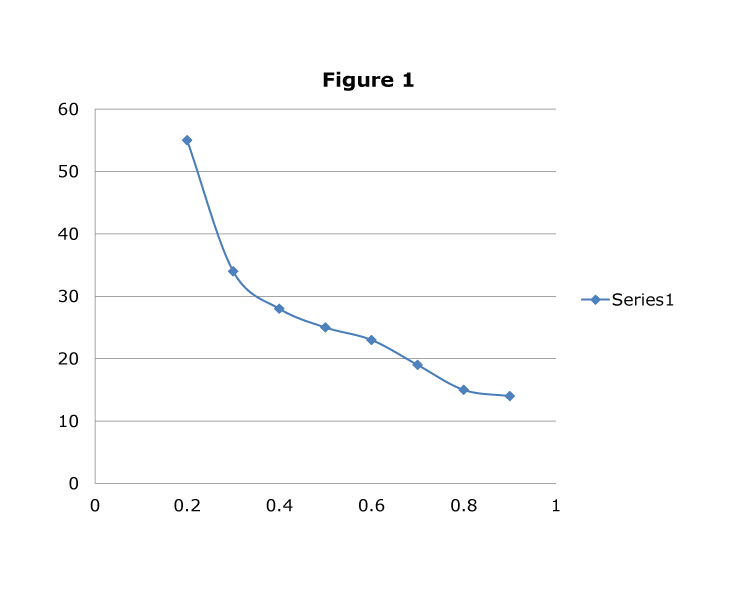
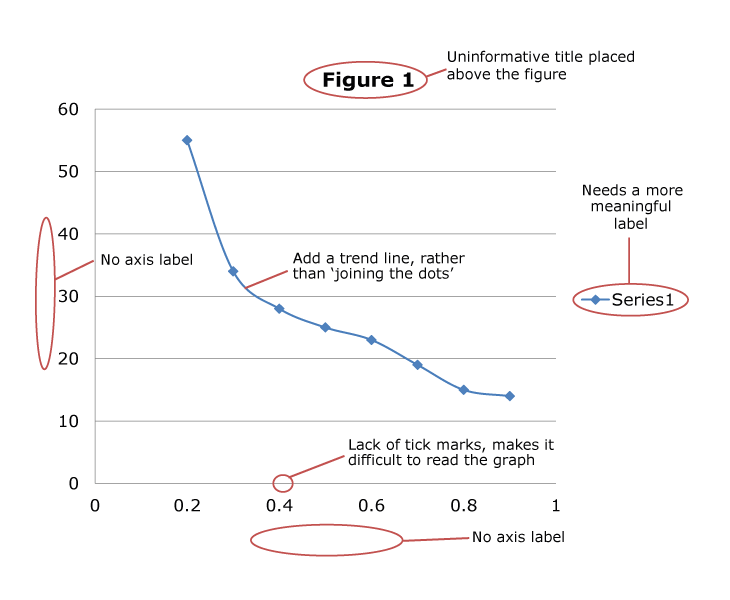
Figures
Tables
Text
Activity
You are marking a series of undergraduate lab reports. Below is a graph of the resting heart rates of a group of students. This graph appears in the results section of one of the reports you are marking.

Give this student some feedback to help them improve their data presentation.

