|
|
Ecology Writing Guide |
|
|
")
|

Tables
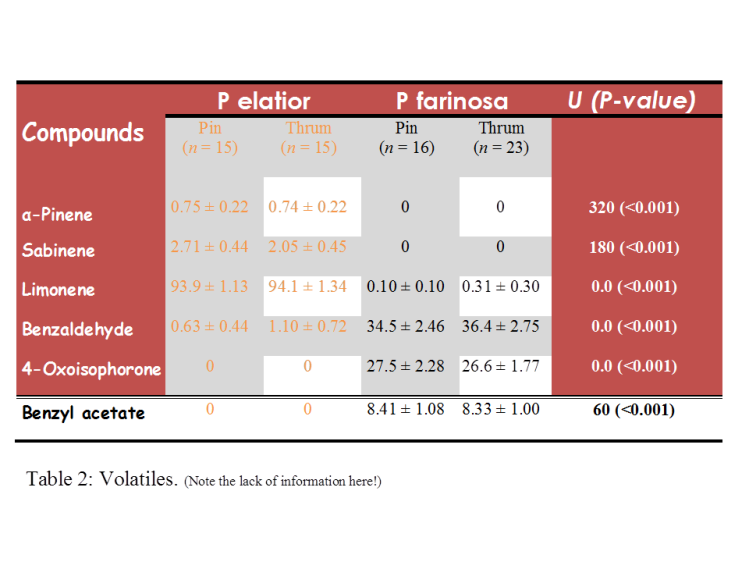
Tables can be used to display data or statistical results (eg, means and standard errors). Like figures, if you want to include a table, you must refer to it in the text. Use a simple layout without vertical lines (Table 1) and avoid over-formatting your table (Table 2). Place a comprehensive caption above and any explanatory notes below the table. Make sure you provide full species names.
Compare tables 1 and 2 below. Which is easier to read and understand?
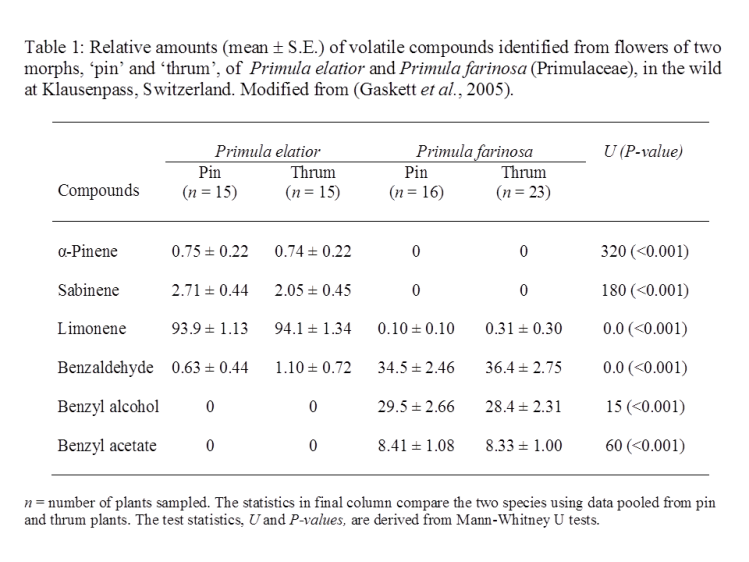
Gaskett, A.C., Conti, E. & Schiestl, F.P. (2005). Floral odor variation in two heterostylous species of Primula. Journal of Chemical Ecology, 31, 1223-1228.

